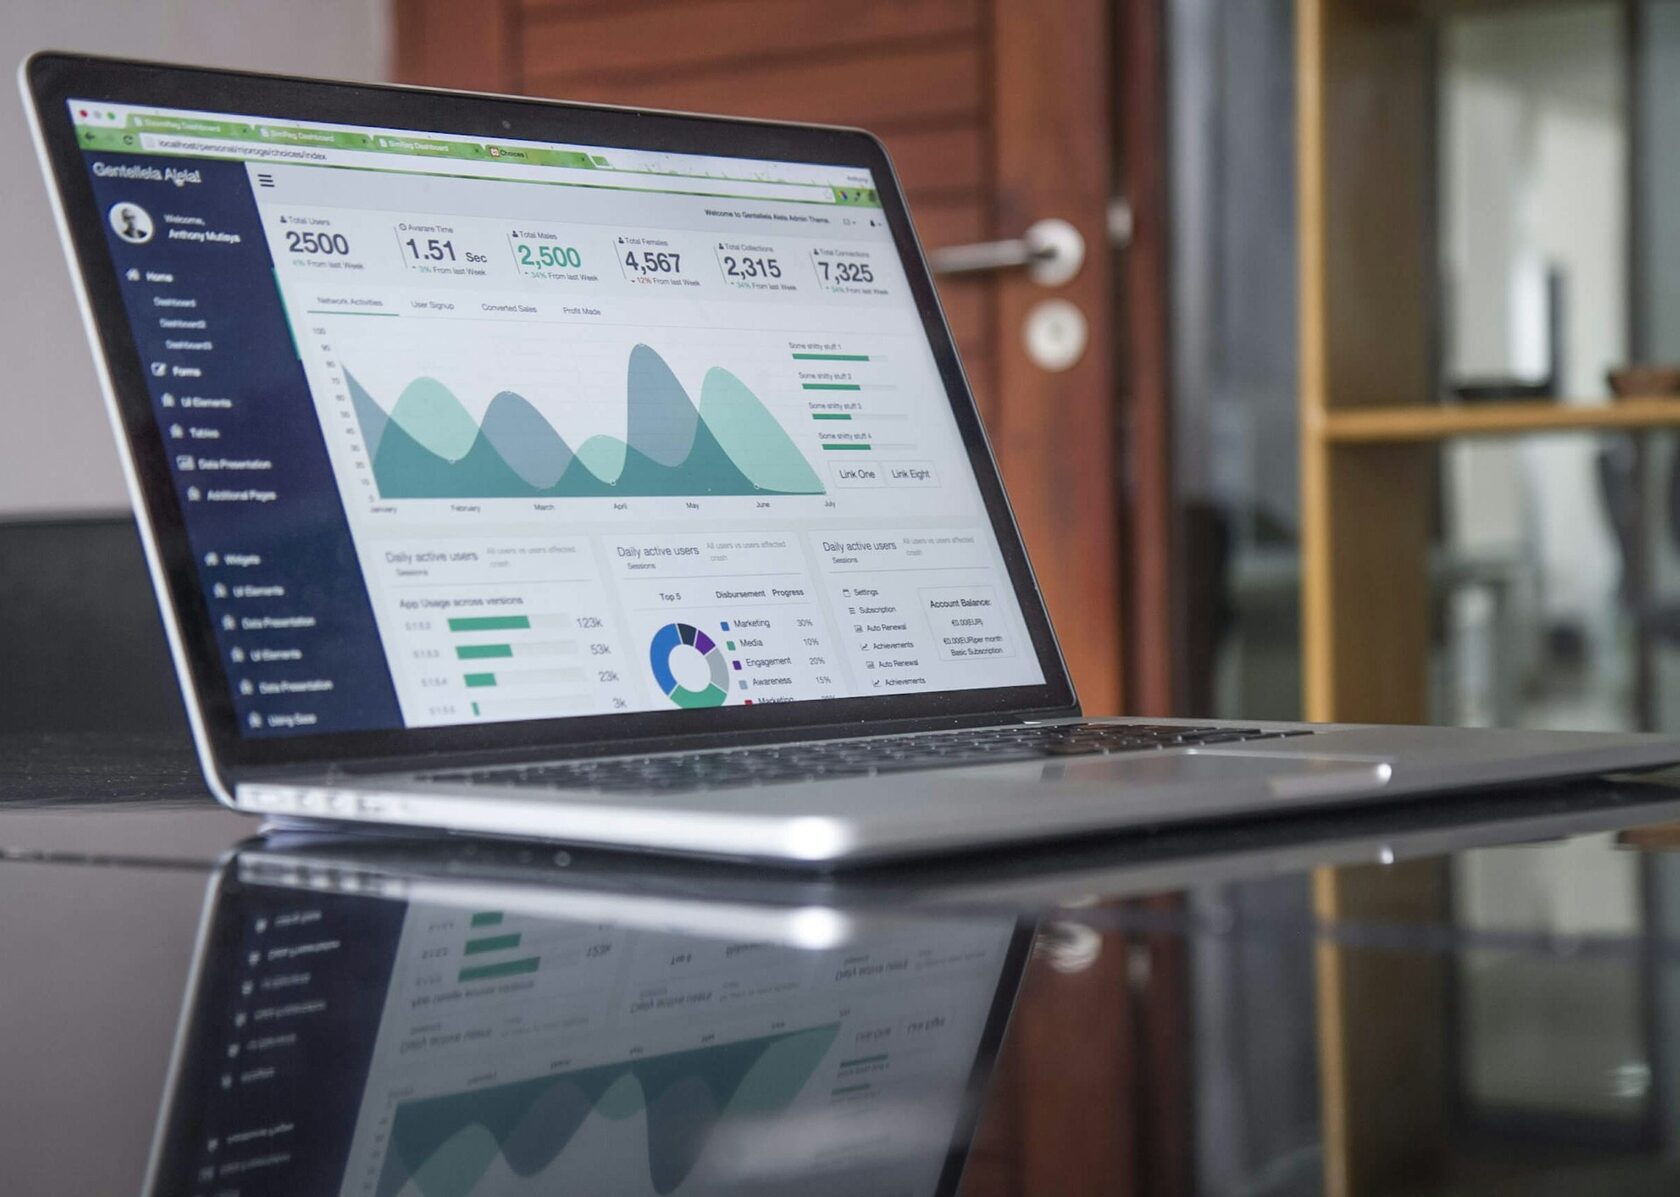
The report combines financial data, field results, and human stories through custom infographics, photography, and clean typography. The goal was to make key information easy to understand for donors, partners, and a wider audience, while maintaining clarity and consistency across different sections.
An interactive PDF version was also developed, allowing readers to explore data by region and initiative. This approach turns a traditionally static document into a more dynamic experience, supporting deeper engagement with the organization’s work.